Lisa Kiepert
05.19.2026
Summary
Oil analysis is one of the most powerful tools in predictive maintenance, but most programs leave gaps that limit results. This guide breaks down the full oil analysis process, from sampling and contamination control to lab testing, sensors, and continuous monitoring, while showing how integrated tools and data improve equipment reliability. Whether you’re building a program from scratch or improving an existing one, the goal is the same: better decisions before failures happen.
Detect Problems Early and Turn Data into Action
Oil analysis is often treated like a lab test. Take a sample. Send it out. Wait for a report. React if something looks bad. That’s the problem.Oil analysis is not a single activity it’s an entire reliability process. And when one part of that process breaks down, the data becomes less valuable, less actionable, and sometimes completely misleading.
Most lubrication failures don’t happen because organizations lack data. They happen because the data wasn’t representative, contamination wasn’t controlled, problems weren’t caught early enough, or nobody connected the information together.
A strong oil analysis program doesn’t just identify failures. It helps prevent them.
This guide breaks down the complete oil analysis ecosystem from sampling and contamination control to continuous monitoring and predictive analytics, and explains what actually makes a program effective.
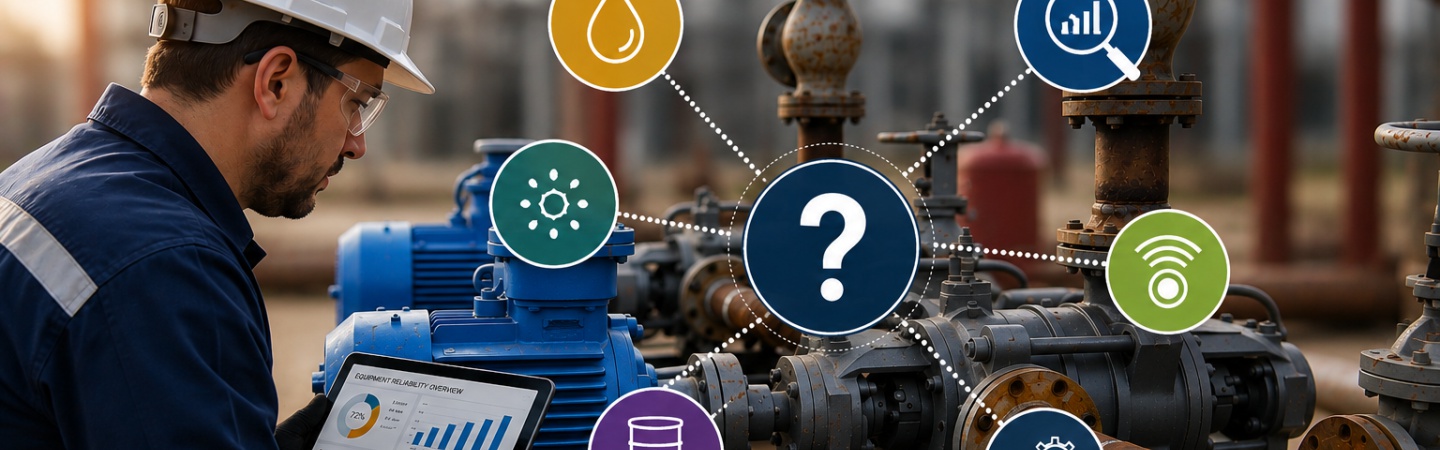
What Oil Analysis Actually Does
At its core, oil analysis answers a simple question: What is happening inside the machine that we cannot see?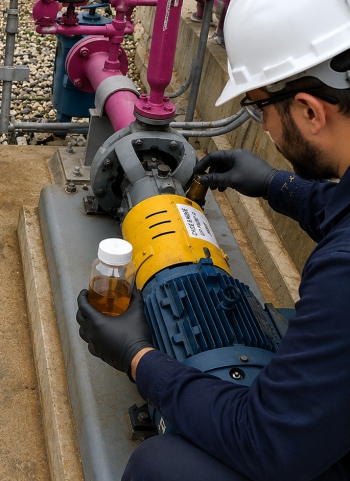
Lubricant moves through every critical zone in a system. Along the way, it collects information:
- Wear particles
- Contamination
- Moisture
- Oxidation byproducts
- Temperature effects
- Viscosity changes
- Additive depletion
Done correctly, oil analysis can help identify:
- Early component wear
- Water ingress
- Dirt contamination
- Lubricant degradation
- Filtration issues
- And more
That’s why oil analysis is foundational to predictive maintenance programs not just lubrication programs.
Most Oil Analysis Programs Fail Before the Sample Hits the Lab
 This is where many programs quietly fall apart. The assumption is usually: “If the lab is good, the results will be good.” Not necessarily.
If the sample is contaminated, inconsistent, or taken from the wrong location, the lab can only analyze the bad sample it received. Garbage in. Garbage out.
Common sampling mistakes include:
- Sampling from drain ports
- Pulling samples after shutdown
- Sampling from stagnant reservoir zones
- Using inconsistent locations
- Using dirty sampling equipment
- Cross-contaminating samples during collection
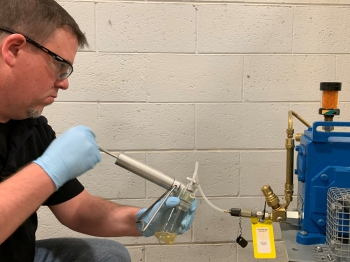
A representative sample must come from an active flow zone where the lubricant accurately reflects machine conditions.
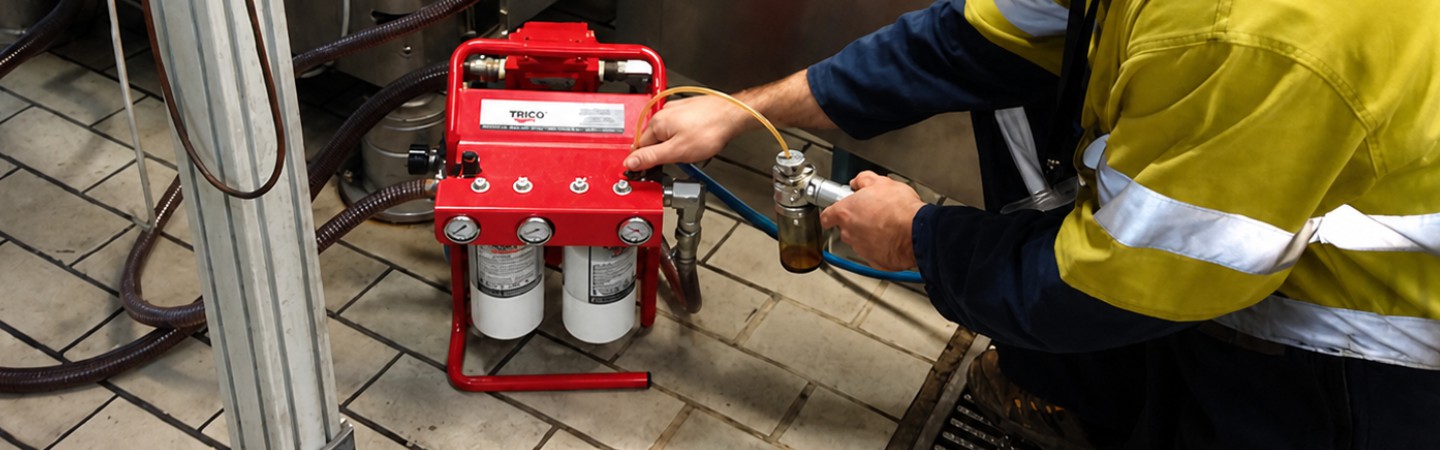
That’s why proper sampling hardware and repeatable procedures matter so much.
Consistency creates trendable data. Trendable data creates reliability.
The Hidden Role of Contamination
Contamination is one of the biggest drivers of lubricant and equipment failure.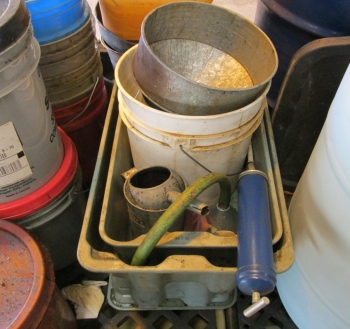
And most contamination starts long before oil reaches the machine.
It enters during:
- Storage
- Transfer
- Handling
- Application
- Breathing cycles
- Maintenance activity
That means contamination control cannot begin at the machine. It has to begin across the entire lubrication process.
Effective contamination control often includes:
- Desiccant breathers
- Properly sealed storage
- Dedicated transfer containers
- Filtration systems
- Clean handling practices
- Color coding and identification systems
What the Lab Tests Actually Mean
Oil analysis reports can overwhelm people with numbers, limits, and terminology. But most tests fall into a few major categories.
Wear Analysis
Looks for metallic particles generated by component wear.Can help identify:
- Bearing wear
- Gear wear
- Abrasive contamination
- Fatigue wear
Contamination Analysis
Measures unwanted material inside the lubricant.Includes:
- Water contamination
- Dirt and particulate contamination
- Fuel dilution
- Coolant contamination
Lubricant Health Analysis
Evaluates whether the lubricant itself is still fit for service.Includes:
- Viscosity changes
- Oxidation
- Additive depletion
- Acid formation
The real value isn’t any single test. It’s the combination of data trends over time.
Why Trend Data Matters More Than Single Reports
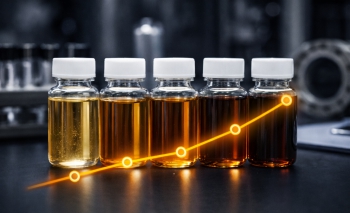 One oil analysis report is a snapshot. A trend is a story.
Single reports can identify obvious problems. Trends identify developing problems before they become critical. For example:
- A slight increase in wear metals may not trigger alarms
- A slow upward moisture trend may appear insignificant
- A gradual viscosity shift may go unnoticed
This is where many organizations transition from reactive maintenance to predictive maintenance.
Instead of asking: “What failed?” They begin asking: “What is changing?” That’s a major shift.
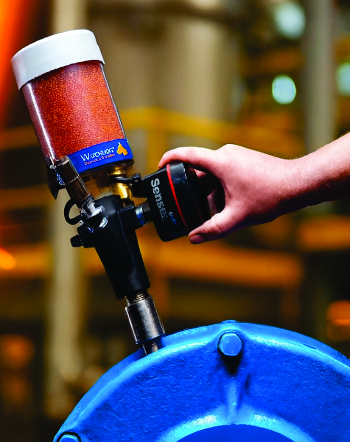
The Shift Toward Continuous Monitoring
Traditional oil analysis is periodic. You sample monthly, quarterly, or based on operating hours. But industrial equipment doesn’t wait for scheduled sampling. That’s why many facilities are expanding into continuous condition monitoring using sensors and connected systems.Instead of waiting weeks for the next sample, sensors can monitor conditions in real time, including:
- Moisture
- Temperature
- Vibration
- Acoustics
- Pressure
Connecting Oil Analysis to Condition Monitoring
Oil analysis becomes significantly more valuable when combined with condition monitoring data.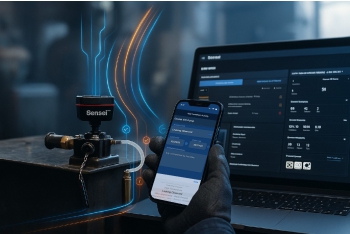
For example:
- Rising wear particles + increasing vibration = accelerated component wear
- Moisture increases + temperature swings = condensation risk
- Pressure fluctuations + contamination spikes = ingress issues
This is where integrated monitoring platforms and connected sensors create a major advantage. Instead of isolated reports, maintenance teams gain continuous visibility.
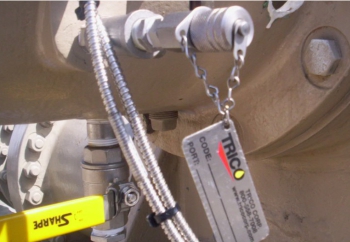
Why Sampling Hardware and Access Points Matter
 If sampling is inconsistent, trend data becomes unreliable.
That’s why dedicated sampling hardware matters more than many organizations realize.
Proper sampling points help ensure:
- Repeatability
- Representative samples
- Safer collection
- Reduced contamination risk
- Faster procedures
Oil Analysis Is Only Valuable If Action Happens
This is where many programs stall. Data gets collected. Reports get stored. Recommendations get ignored. Oil analysis only works when it drives decisions.That may include:
- Changing filtration intervals
- Investigating contamination sources
- Adjusting lubrication practices
- Scheduling inspections
- Correcting storage problems
- Planning maintenance before failure occurs
Building a Complete Oil Analysis Program
 Strong oil analysis programs are built around connected processes, not isolated activities.
That includes:
- Proper Sampling - Consistent procedures and representative sampling locations.
- Contamination Control - Keeping lubricants clean before they ever reach the machine.
- Reliable Testing - Using oil analysis to monitor lubricant condition, contamination, and machine wear.
- Continuous Monitoring - Adding sensors and condition monitoring to close visibility gaps.
- Actionable Data - Turning trends into maintenance decisions.
- Integrated Reliability Strategy - Connecting lubrication, condition monitoring, and predictive maintenance into one process.
Final Takeaway
Oil analysis is not just about checking oil condition. It’s about understanding machine condition. The organizations that get the most value from oil analysis are not the ones collecting the most samples. They’re the ones building systems that connect sampling, contamination control, monitoring, and decision-making into a repeatable reliability strategy. Because the real goal isn’t collecting data. It’s preventing failure before it happens.Need assistance with a new or current program, contact us.
Category:
Tags: