Dan Freeland
03.19.2024
Navigating the Path to Prevention
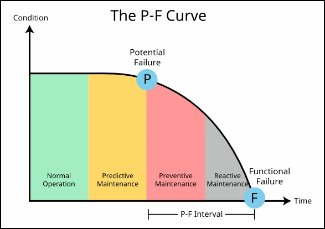 In the context of industrial equipment and the use of Machine VitalsTM for monitoring, the P-F curve is a crucial concept for understanding the relationship between a potential failure (P) and the actual failure (F) of the equipment. The P-F curve illustrates the time window between the initial detection of a potential failure and the point at which the failure becomes inevitable or occurs. This curve is widely used for planning maintenance activities, allowing for interventions to be made before a failure leads to system downtime or significant damage.
Humidity, PPM, and Industrial Equipment:
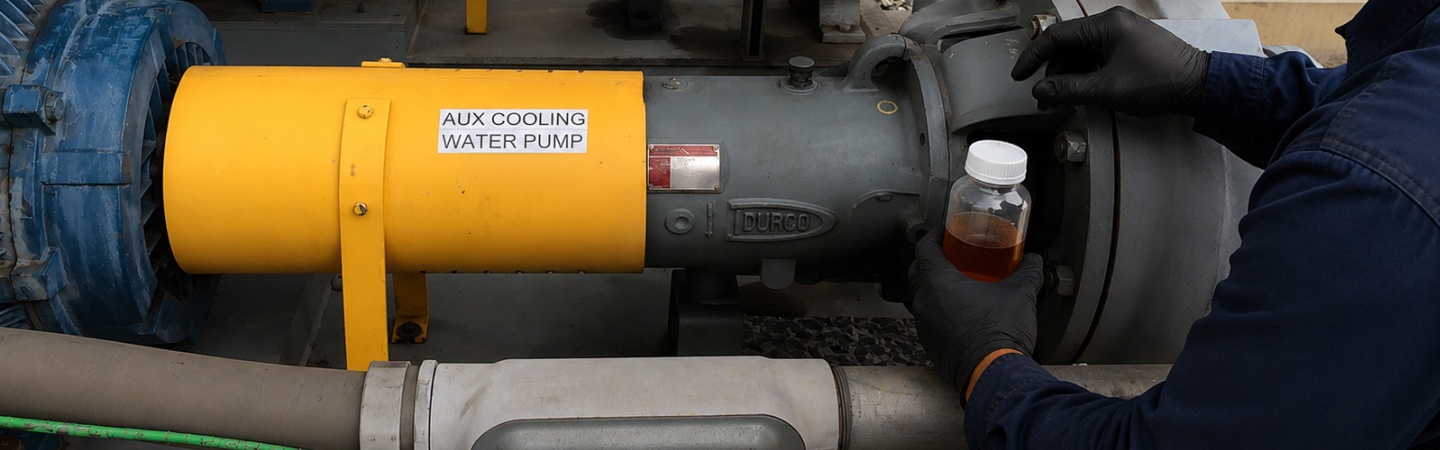
When we talk about humidity and parts per million (PPM) in relation to industrial equipment, we're often referring to the moisture content and contamination levels within the lubrication oil or the operating environment of the asset. For equipment, especially those that are oil-lubricated, the presence of water (high humidity) or contaminants (measured in PPM) in the oil can be early indicators of potential issues that, if left unaddressed, can lead to failure. Humidity: High relative humidity within the oil reservoir can indicate water ingress. Water in oil can cause corrosion, reduce lubrication effectiveness, and lead to premature wear or failure of components like bearings and seals. Continuously high humidity readings should be an early indicator that an oil sample needs to be taken.
PPM (Contaminants): Measuring contaminants in parts per million can indicate the cleanliness of the oil. High levels of contaminants can indicate wear debris from internal components, external contamination, or degradation of the oil itself. These contaminants can accelerate wear and reduce the efficiency of the pump. Karl Fischer oil analysis testing will give you ppm as a result.
Relating Humidity and PPM to the P-F Curve:
Point P (Potential Failure Detection): An increase in humidity or PPM within the oil could be detected by Machine Vitals through its sensor suite. For example, an increase in relative humidity inside the oil reservoir could be detected by the humidity sensor, indicating the early stages of potential failure due to water contamination. Moving Towards F (Failure): As the condition worsens, the effects on the pump's performance and component integrity could become more pronounced. For instance, bearings might begin to show increased wear, temperatures may rise due to ineffective lubrication, and vibration levels may increase as components become more damaged.
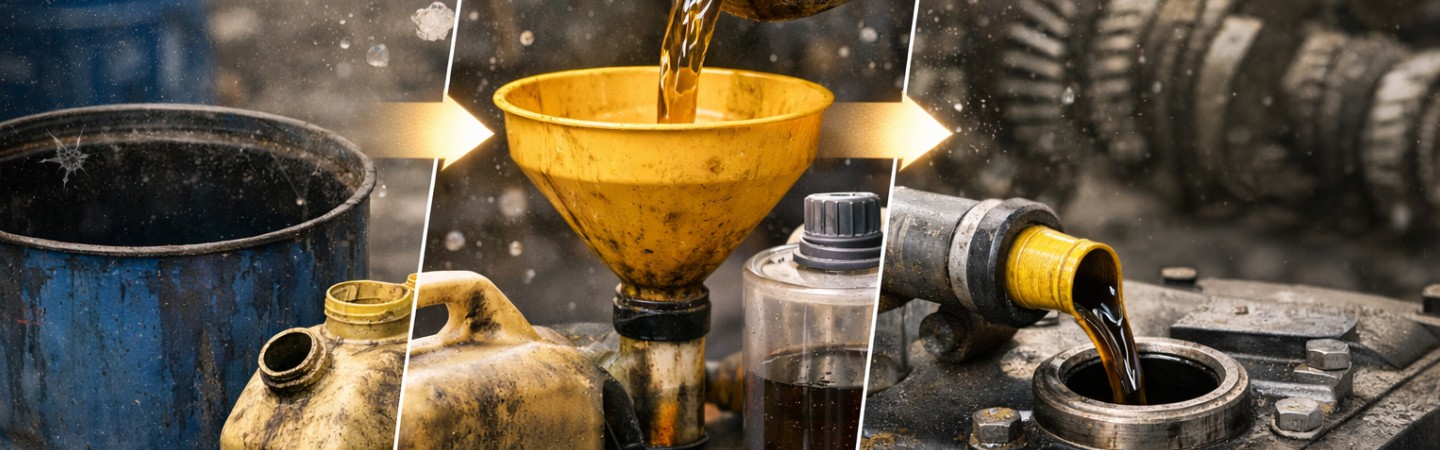
Maintenance Window: The period between P and F on the curve represents the critical window for maintenance actions to prevent failure. By monitoring humidity and PPM levels, maintenance teams can intervene early, perhaps by changing the oil, inspecting for, and addressing leaks, or cleaning the system to remove contaminants.
For implementing this with Machine Vitals, the configuration would need to include:
- Setting thresholds for humidity and PPM levels that trigger alerts or maintenance actions.
- Analyzing trends over time to predict when these thresholds might be reached.
- Integrating with cloud-based algorithms to process the sensor data, compare it against historical baselines, and refine predictions for maintenance needs.
Learn more about what Machine Vitals can do for you!!
Category:
Tags: