From discoveries to decision in minutes
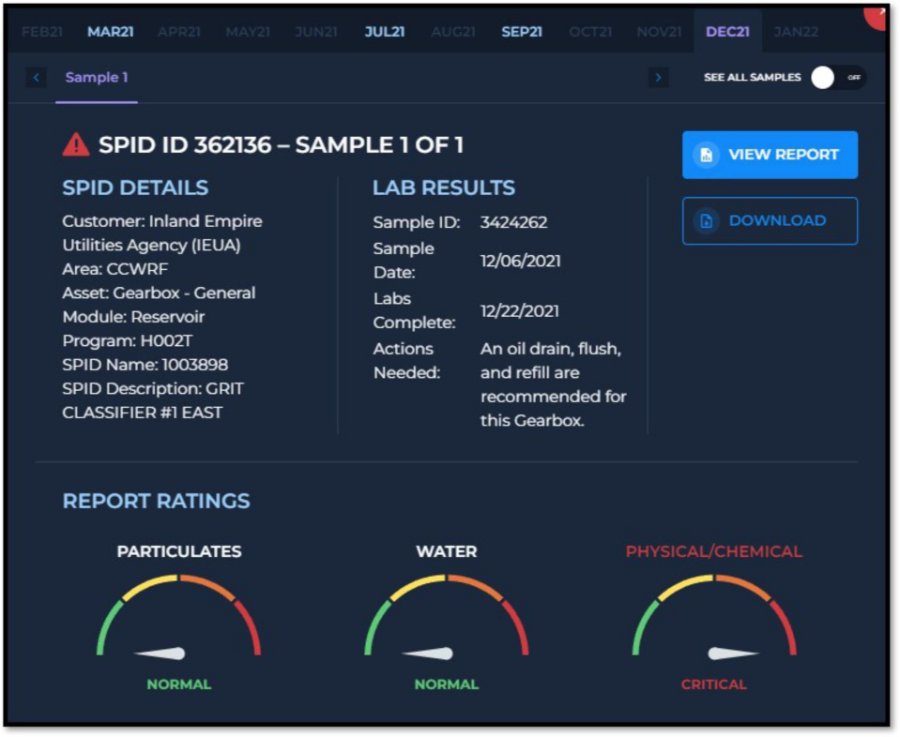
Orbital's dashboard and visuals present analytics simply and intuitively so you can quickly see what is happening and make guided decisions with confidence.
01 Detect

02 Analyze

03 Diagnose

04 Act

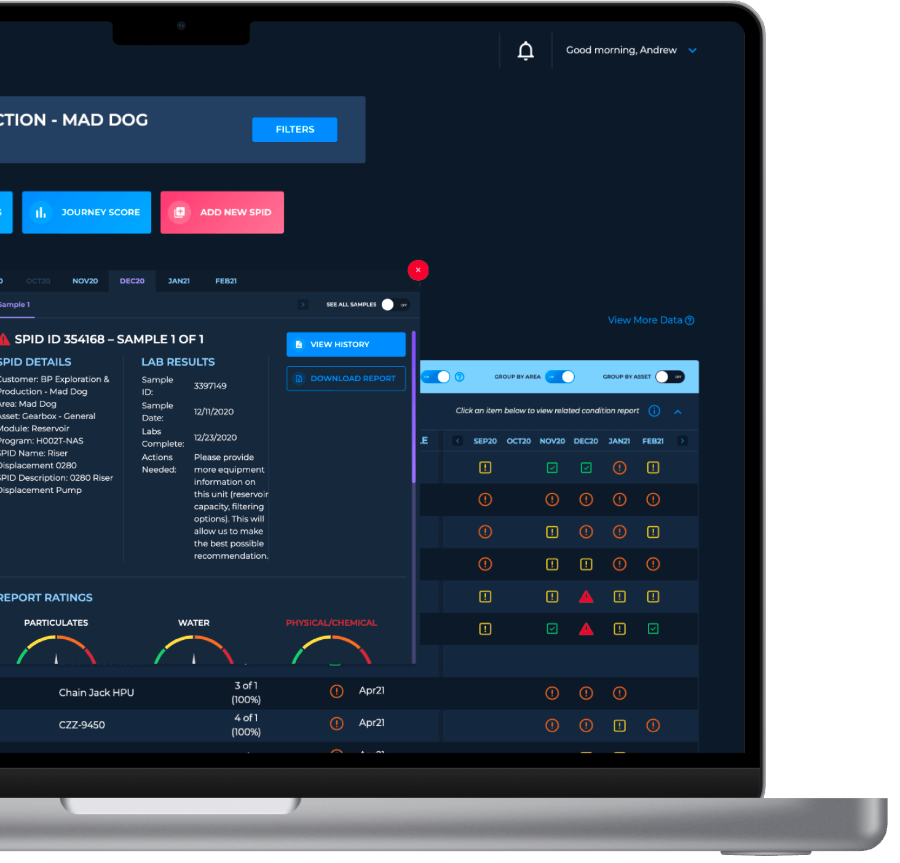
Dimensional Sampling is the Key to Oil Intelligence
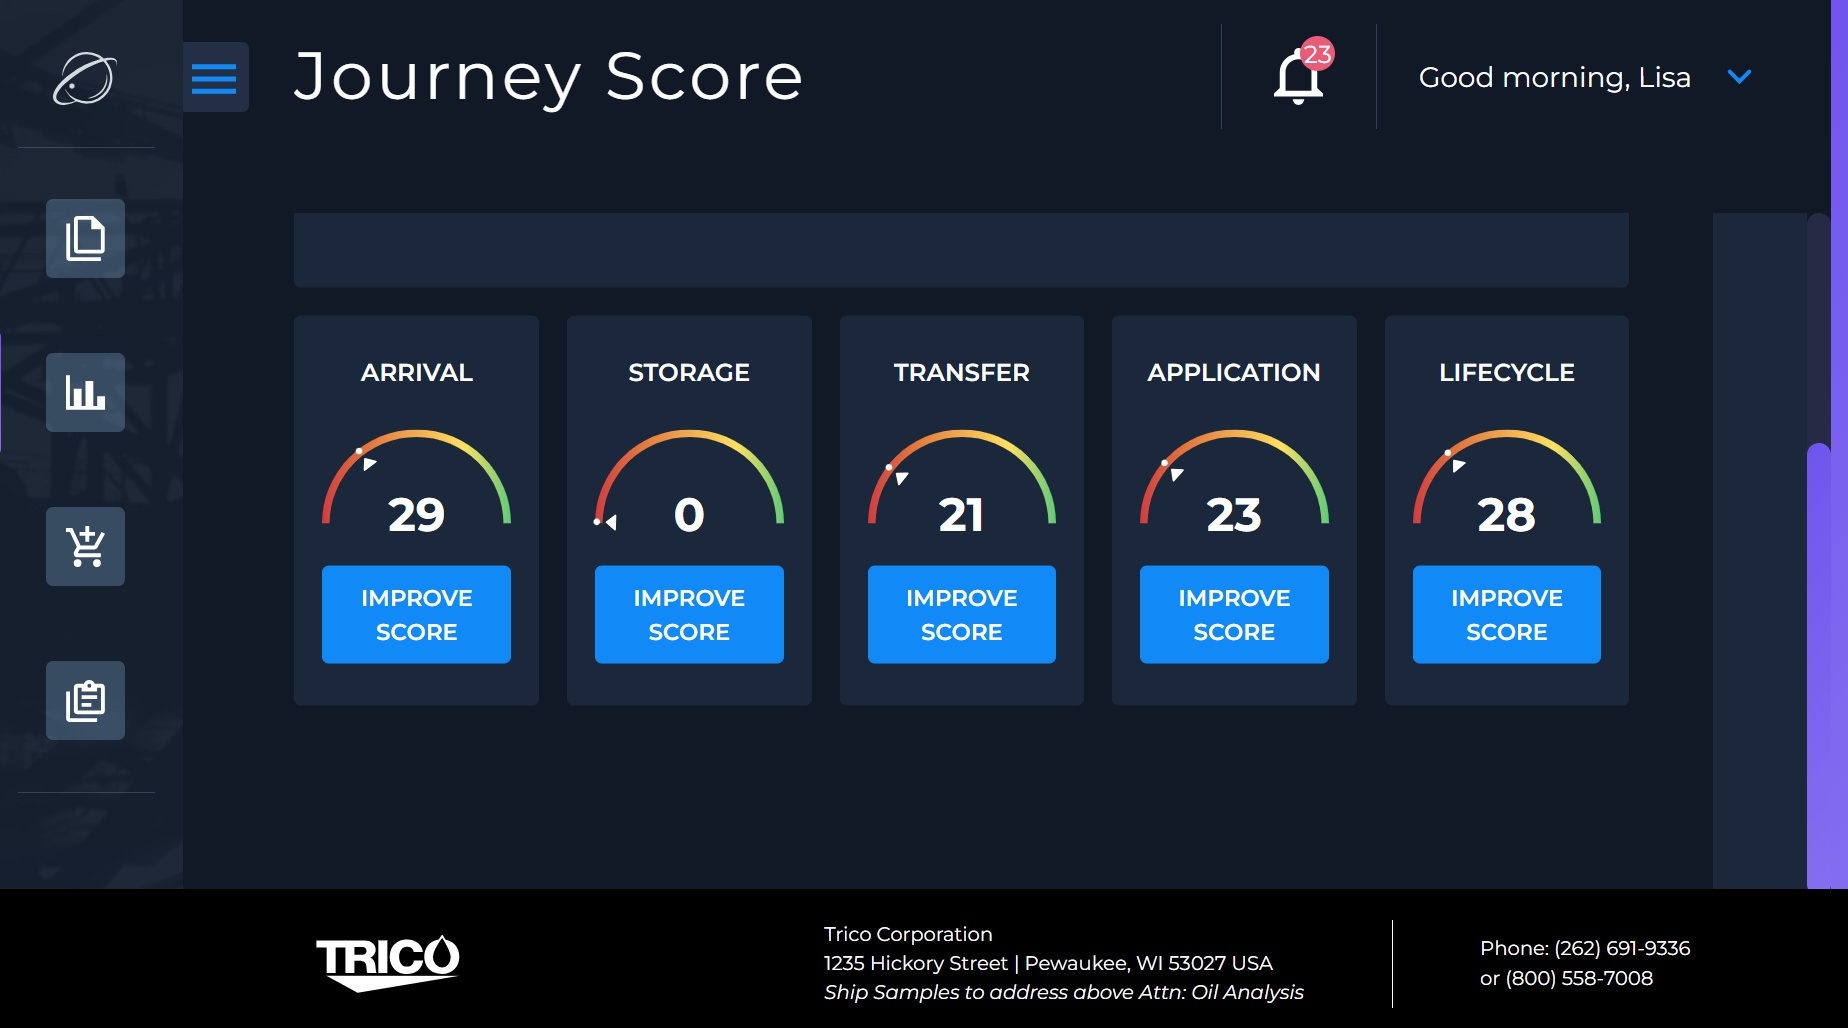
Problems can begin across five stages of your lubricants' Journey.
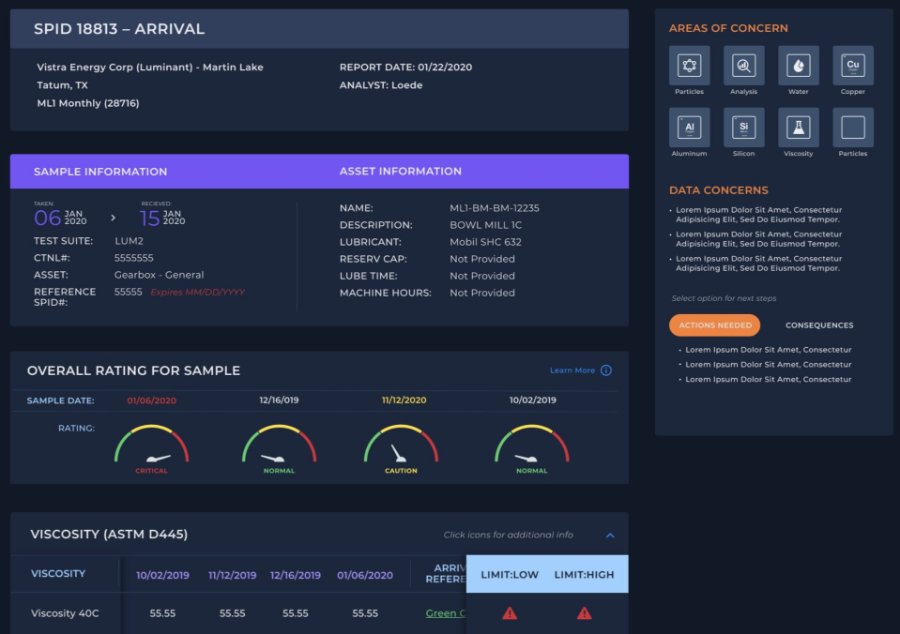
Arrival
Orbital provides indication of the condition and care your supplier has taken to ensure lubricant meets specifications and is contaminant free.
Explore MoreTransfer
Provides the best baseline for equipment test results. Any changes from storage to transfer is affected by personnel interactions.
Explore MoreApplication
Oil analysis offers the earliest warnings of wear and helps detect detrimental contamination.
Explore MoreLifecycle
Effective maintenance programs incorporate on-going, routine oil analysis, and data trending for continuous improvements.
Explore More
Orbital Surrounds you With Analytics
See the commonality between small and vast amounts of information.
Correlation
Visualization
Analysis
Interpretation
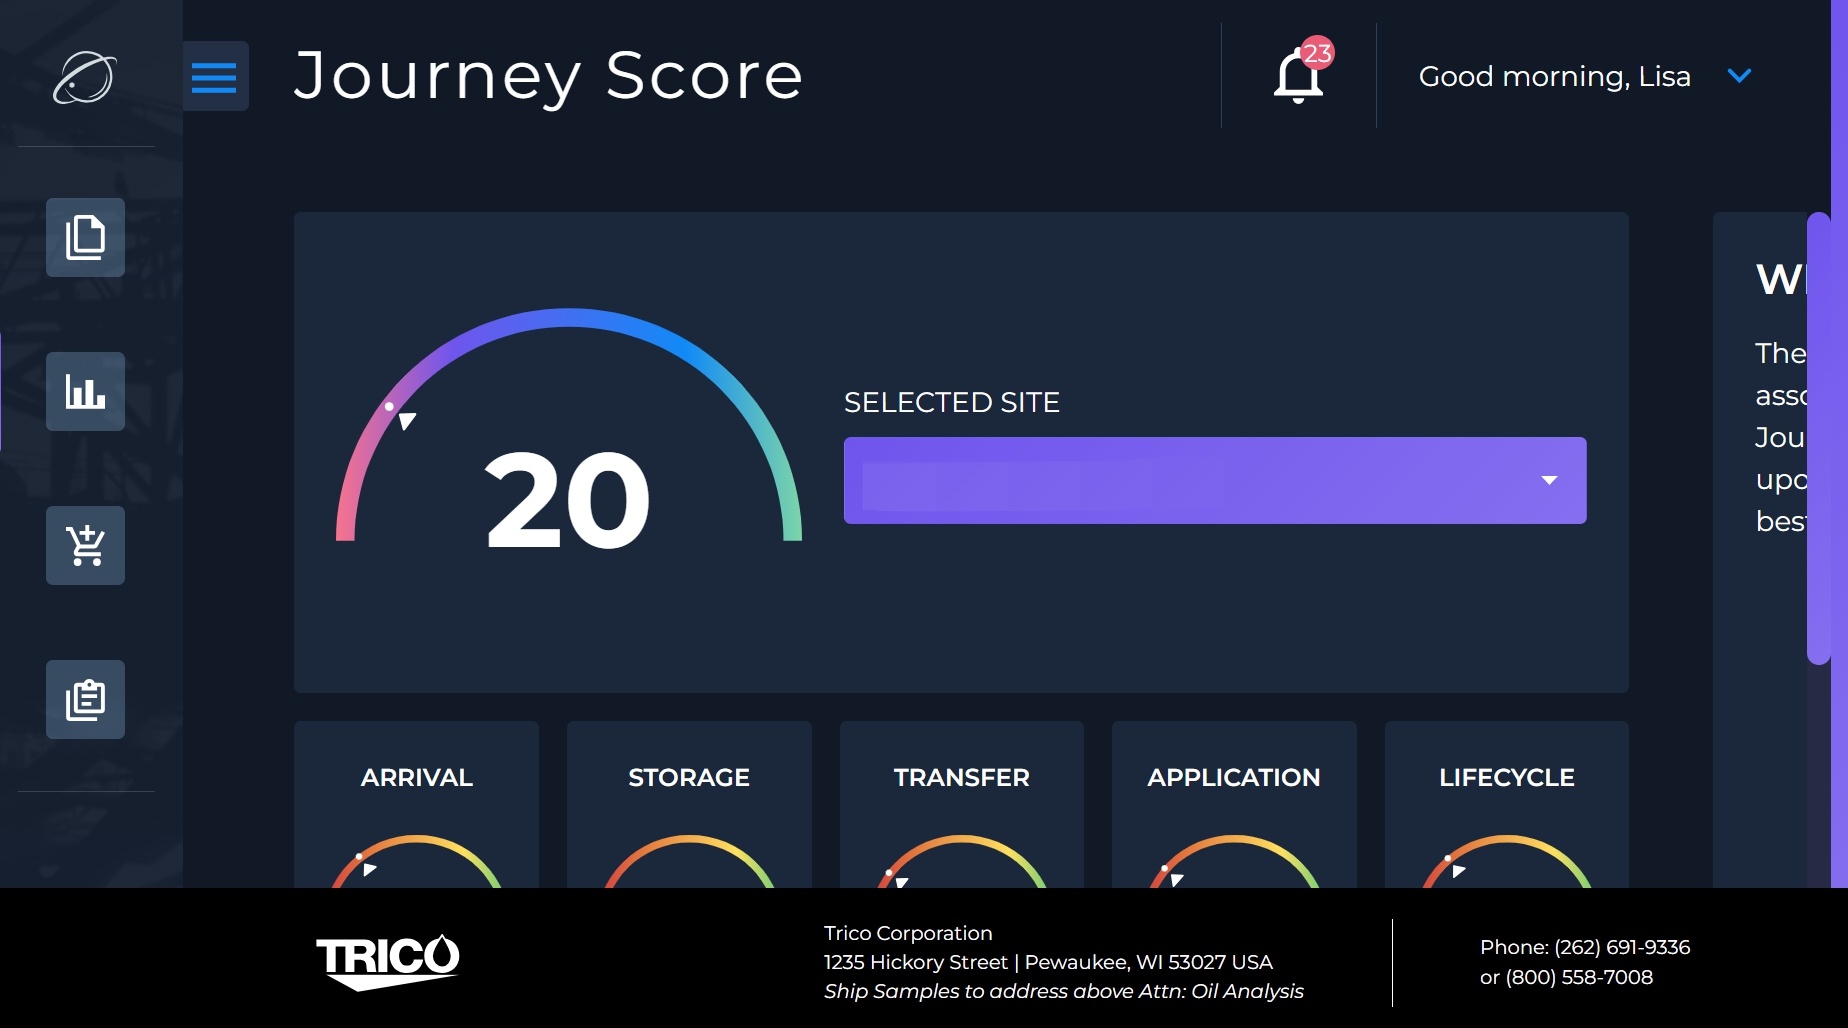
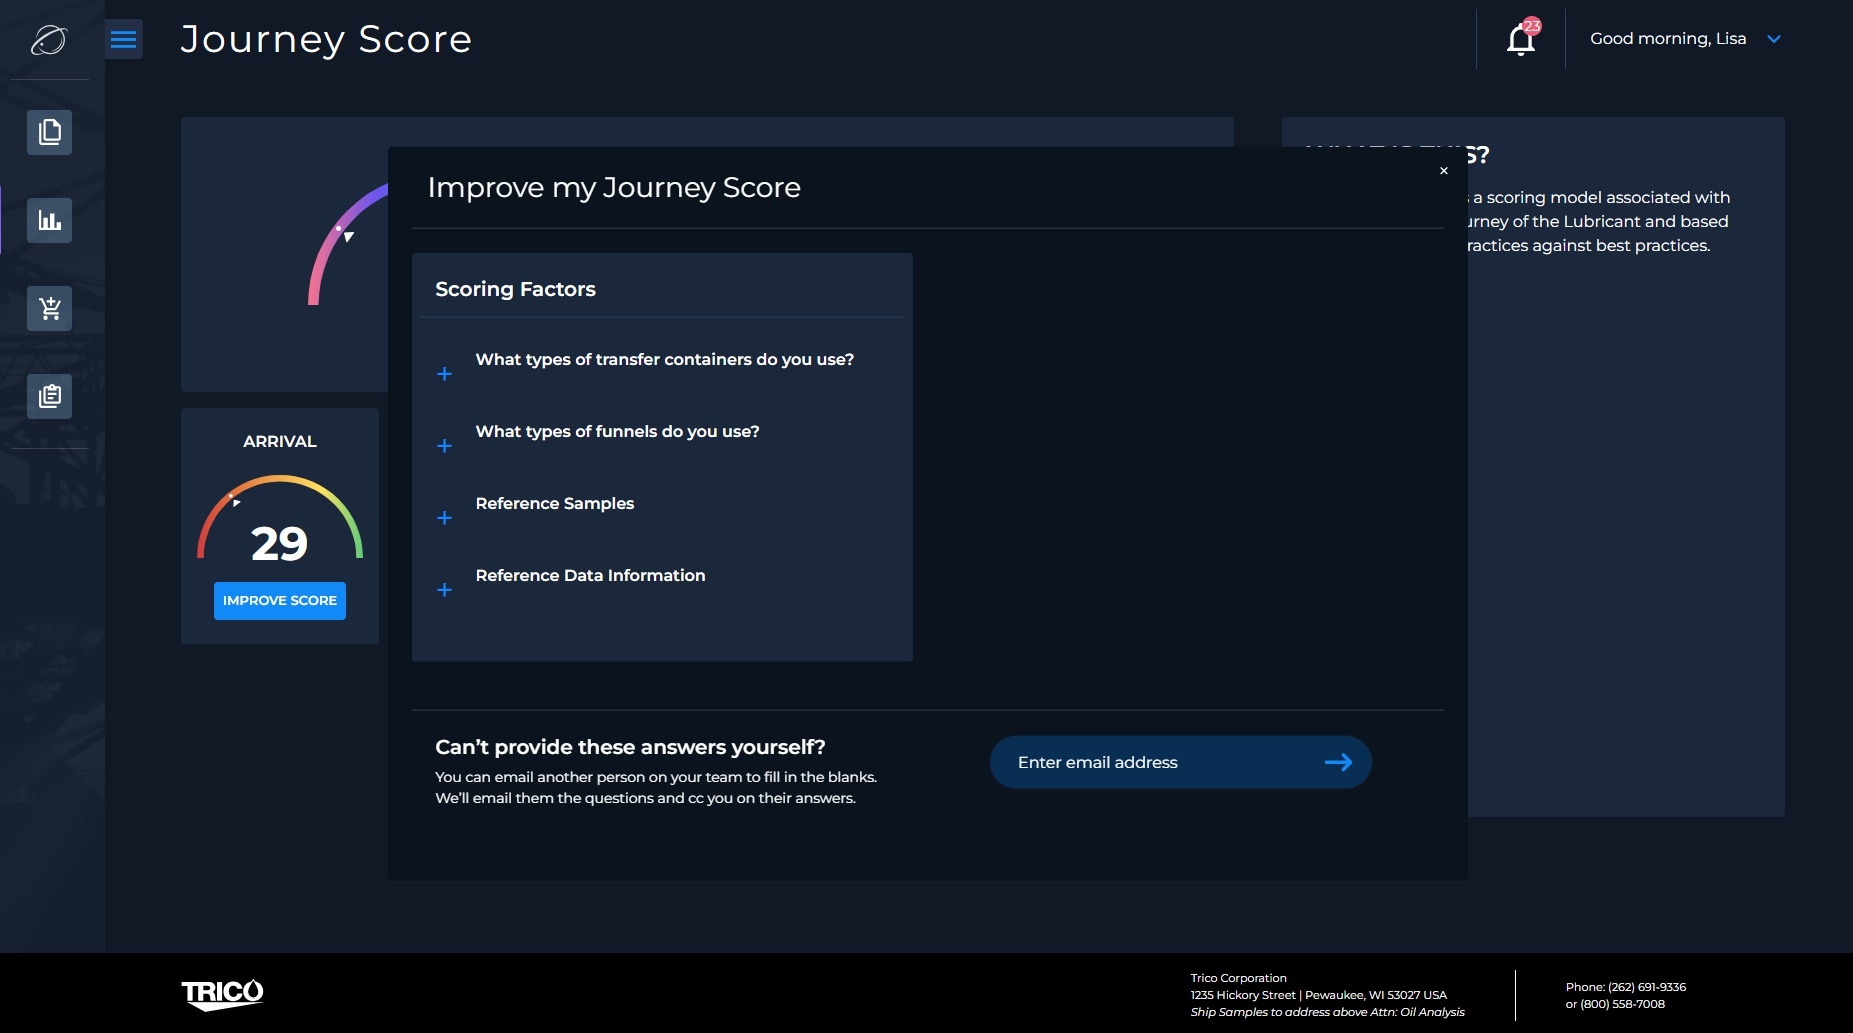
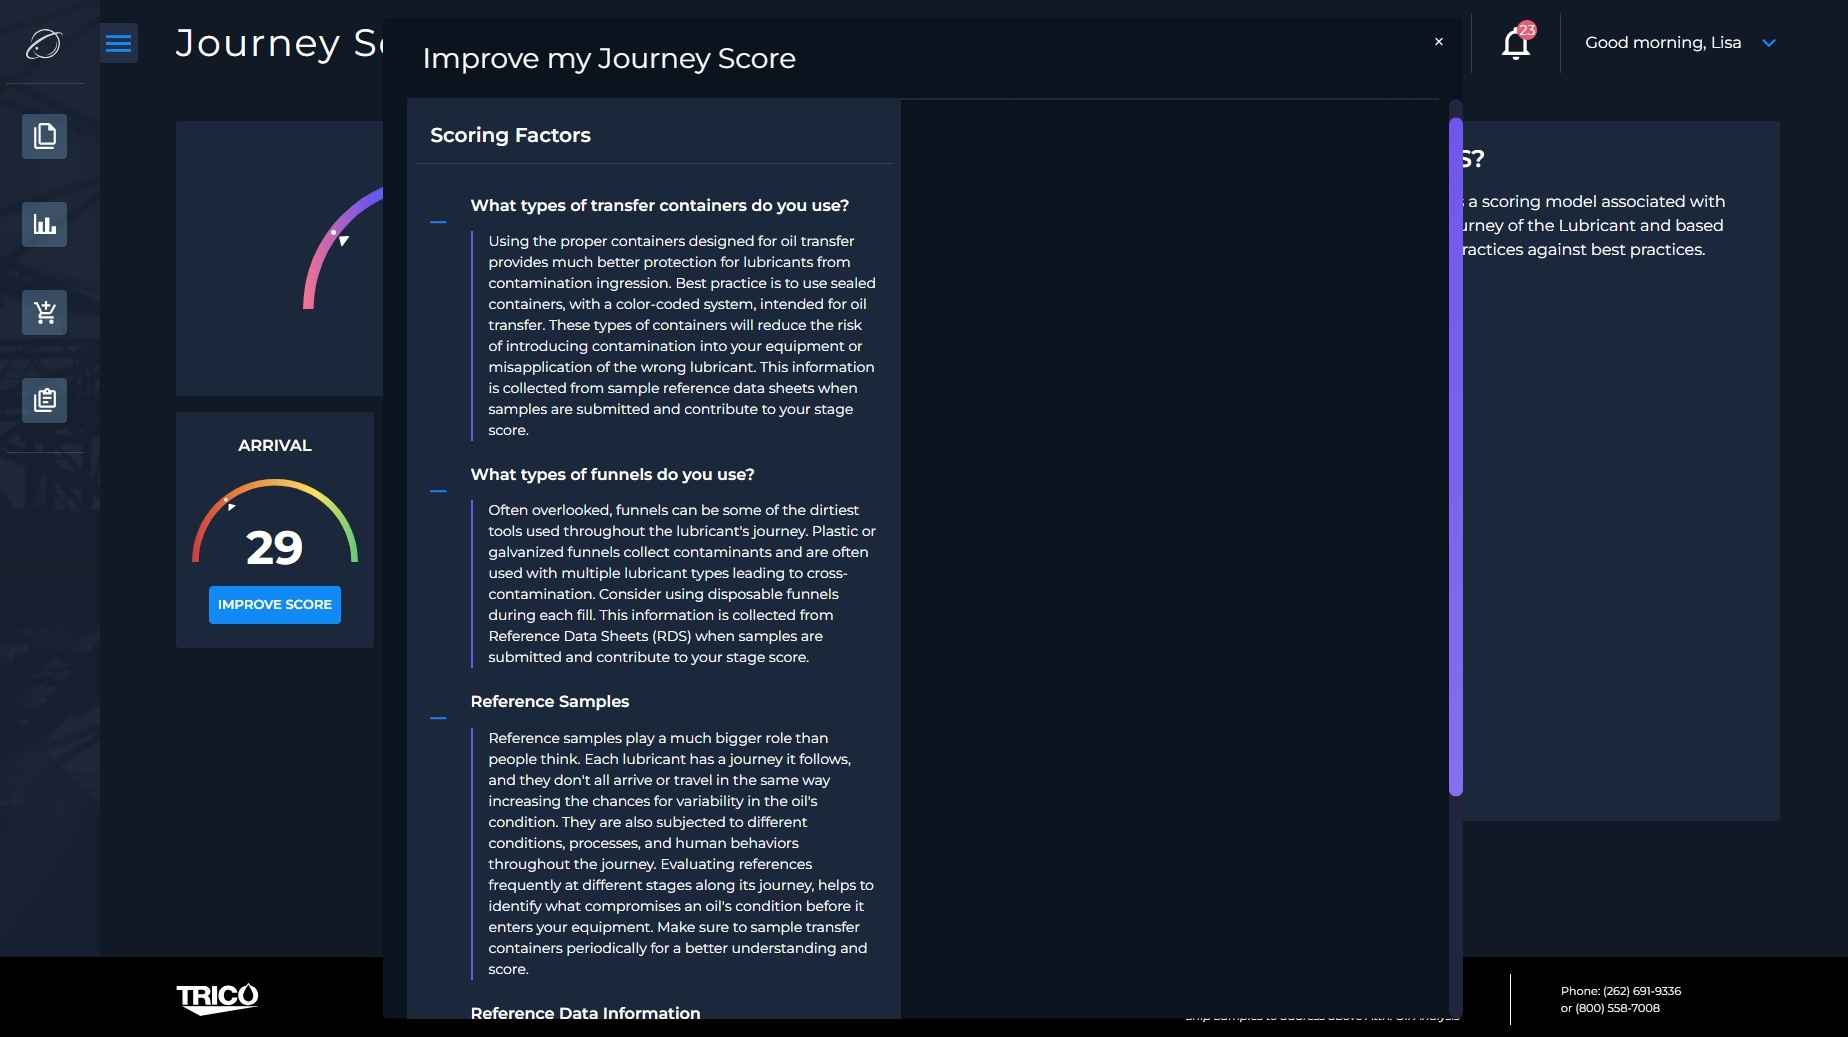
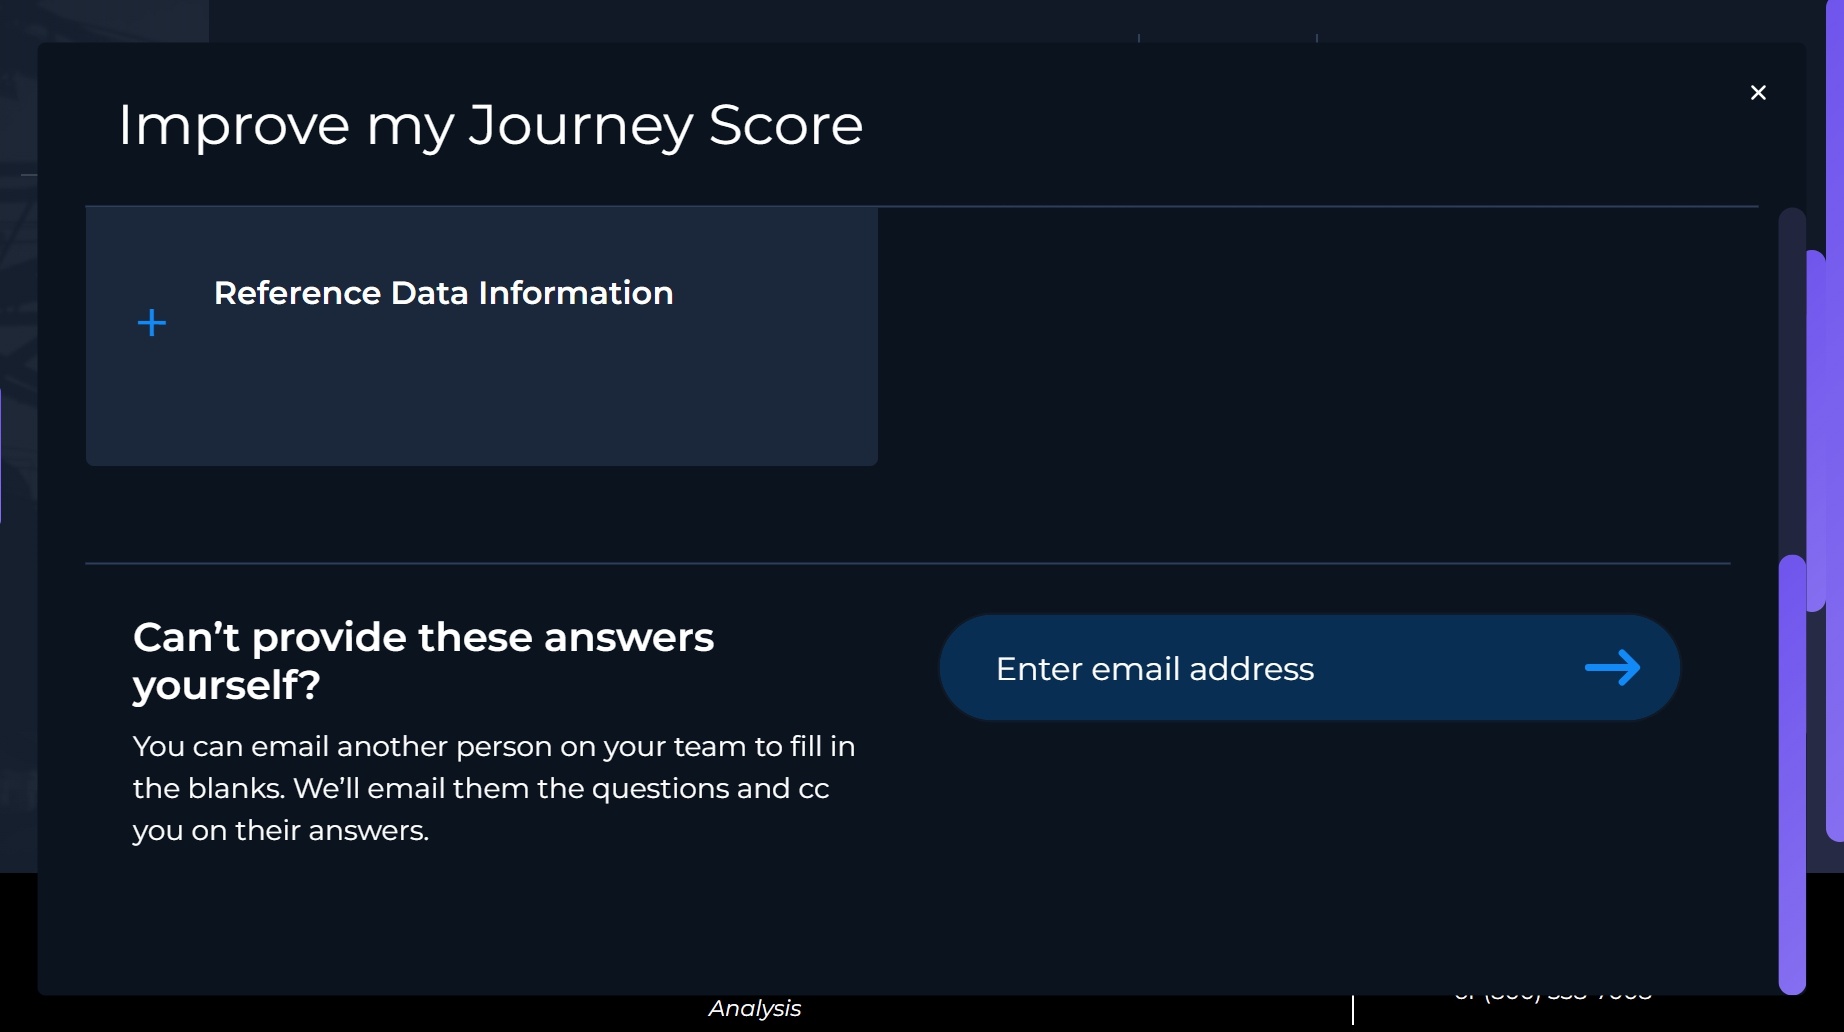
Improve your Process with Journey Score
Provides insight into your practices based on dimensional sampling and info you provide.
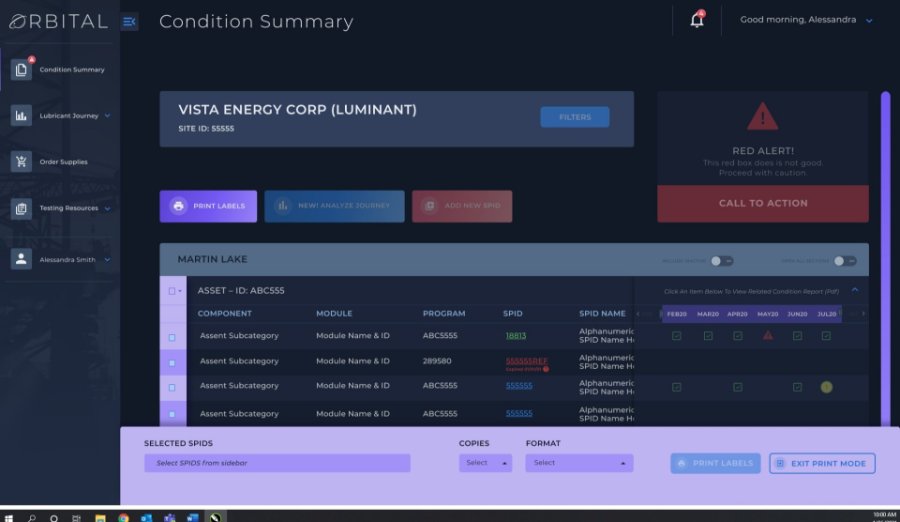
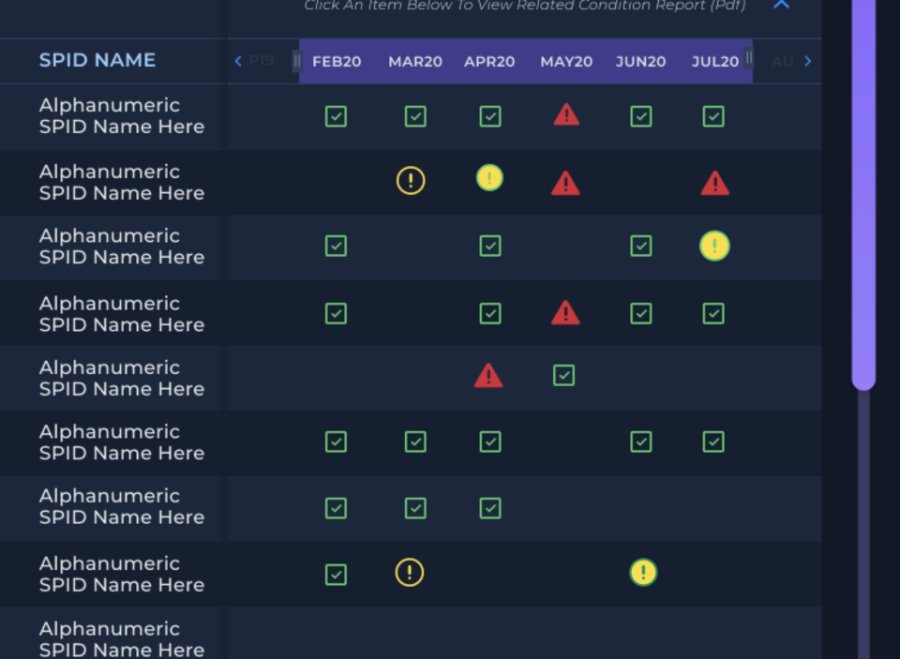
Condition Summary
Problems can begin across five stages of your lubricants' Journey.
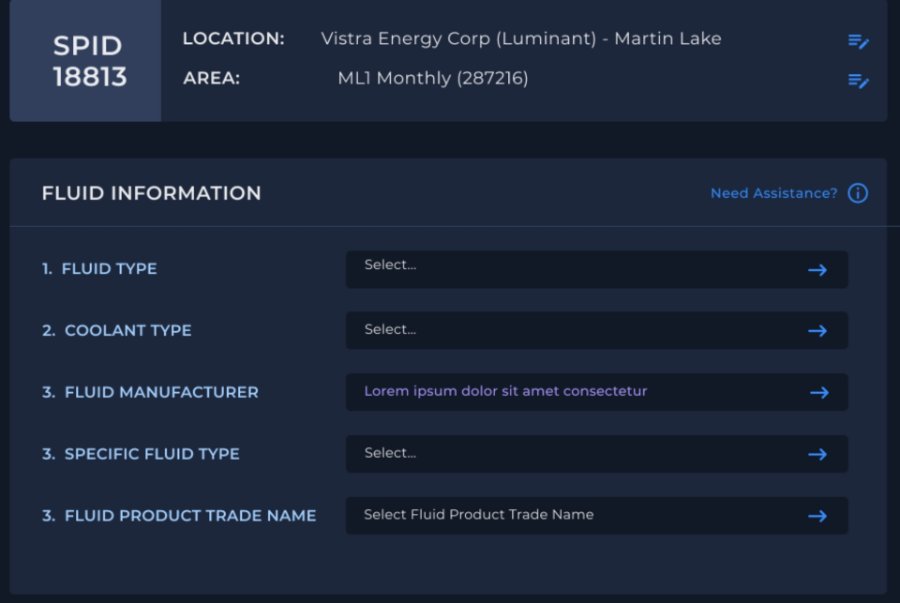
Services
Easily create new SPIDs anytime as well as maintain accurate and up-to-date equipment and lubricant data. Orbital lets you see what detail is missing.
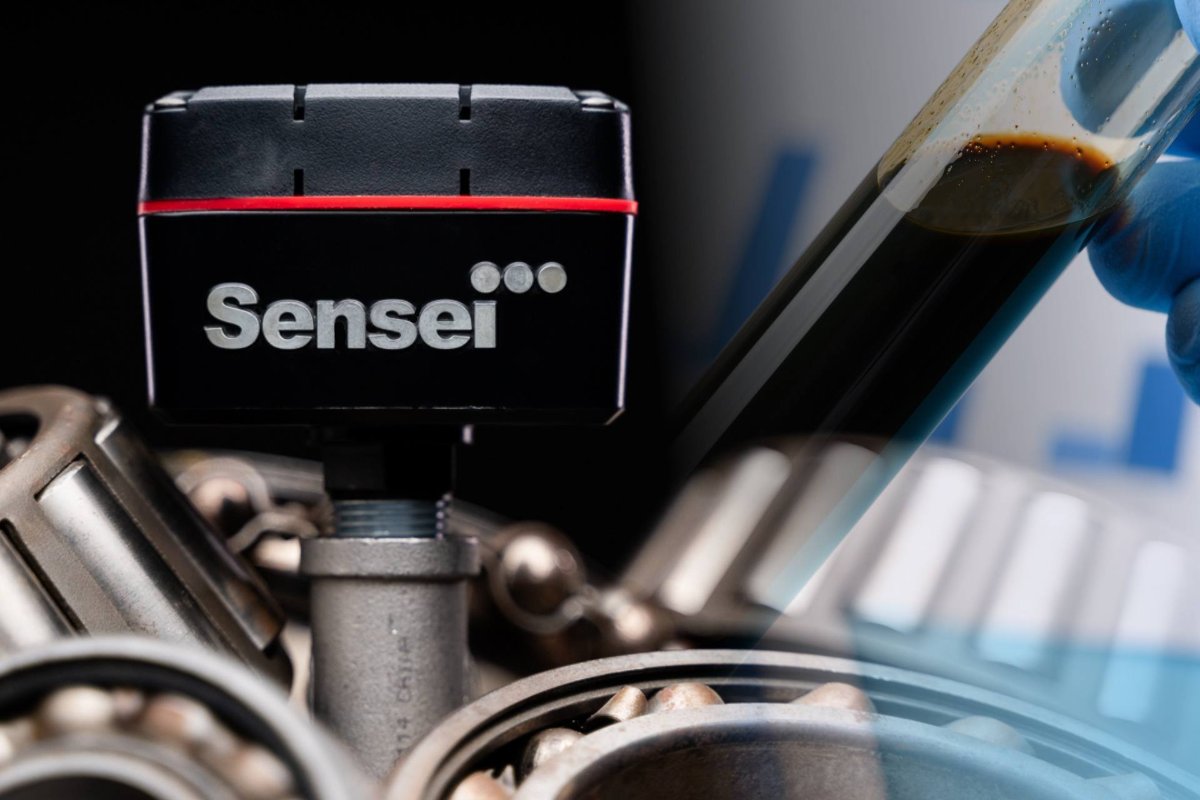
Merging Machine Vitals with Oil Analysis
Holistic Equipment Management
Combining Machine VitalsTM with oil analysis elevates equipment maintenance to a new level of precision and foresight. This integration offers continuous monitoring of operational conditions, such as temperature, relative humidity, and pressure fluctuations, filling the critical gaps between periodic oil analyses. Moreover, the inclusion of the Sensei Platform seamlessly merges oil analysis data with Machine Vitals' sensor data, crafting a comprehensive visual timeline. This timeline not only highlights the correlation between maintenance actions and equipment health but also enhances decision-making by providing clear, actionable insights. Together, this synergy and the analytical power of the Sensei Platform offer a holistic approach to predicting and preventing mechanical issues, ensuring optimal equipment performance.
.jpg?width=1440&height=450&ext=.jpg)

